WEB & DIGITAL / 2026
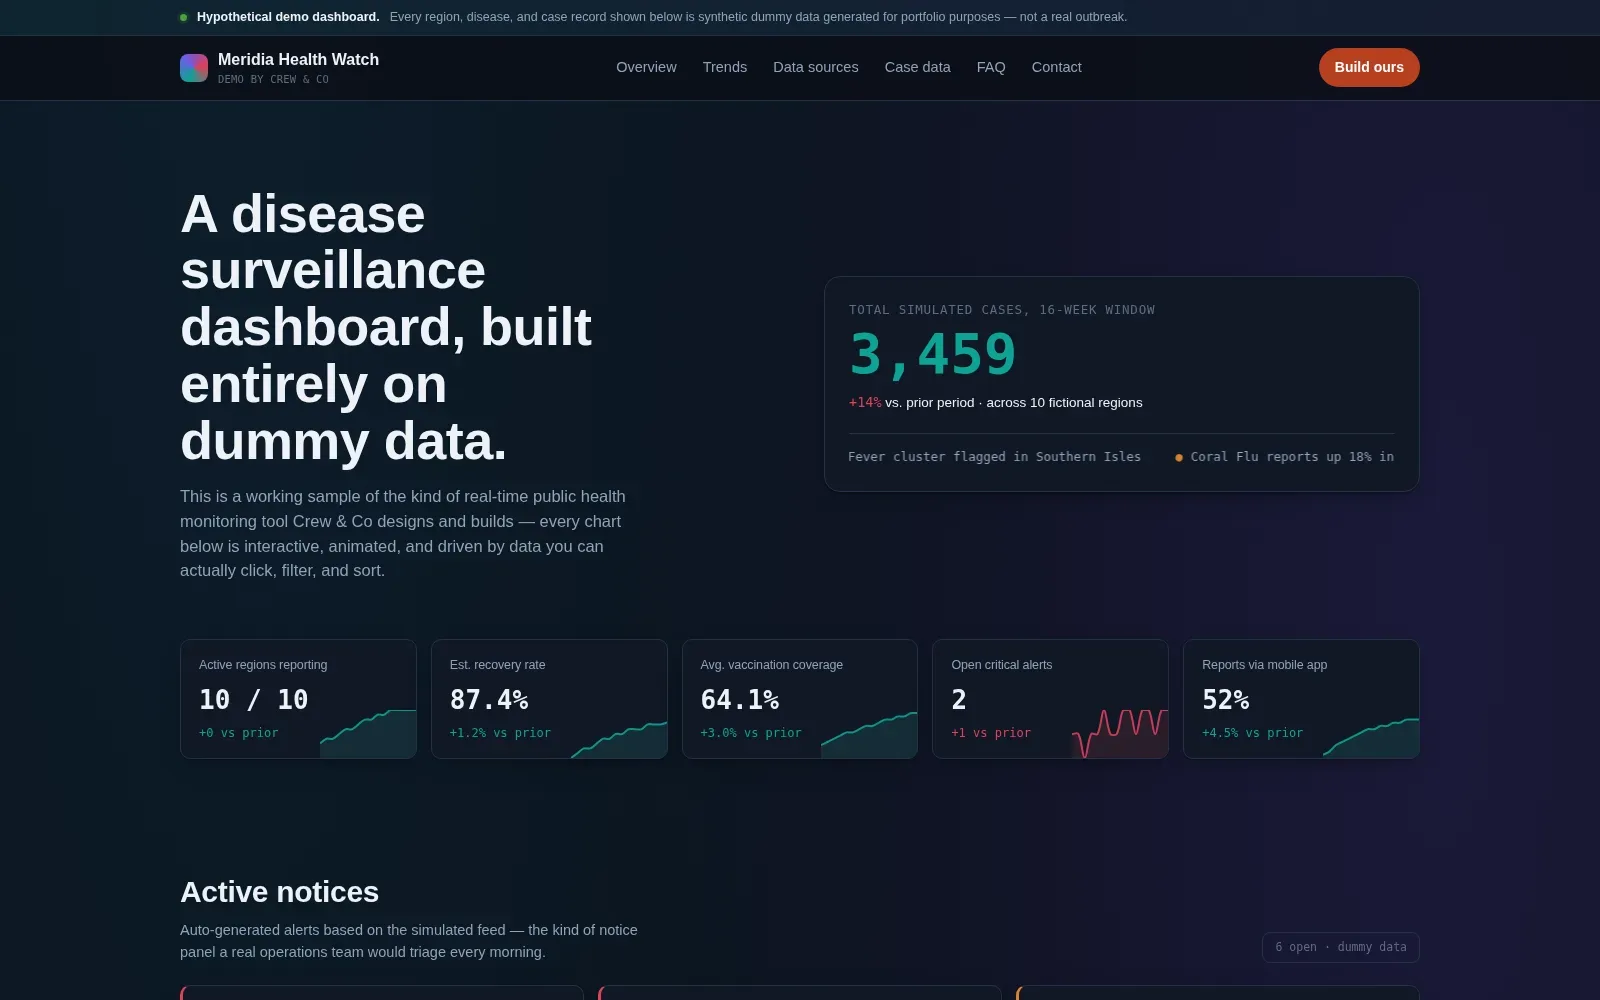
Disease Surveillance Dashboard — Interactive Analytics Demo
A fully interactive disease-surveillance dashboard — sunburst, treemap, bar-chart race, scatterplot…
Case study ↗
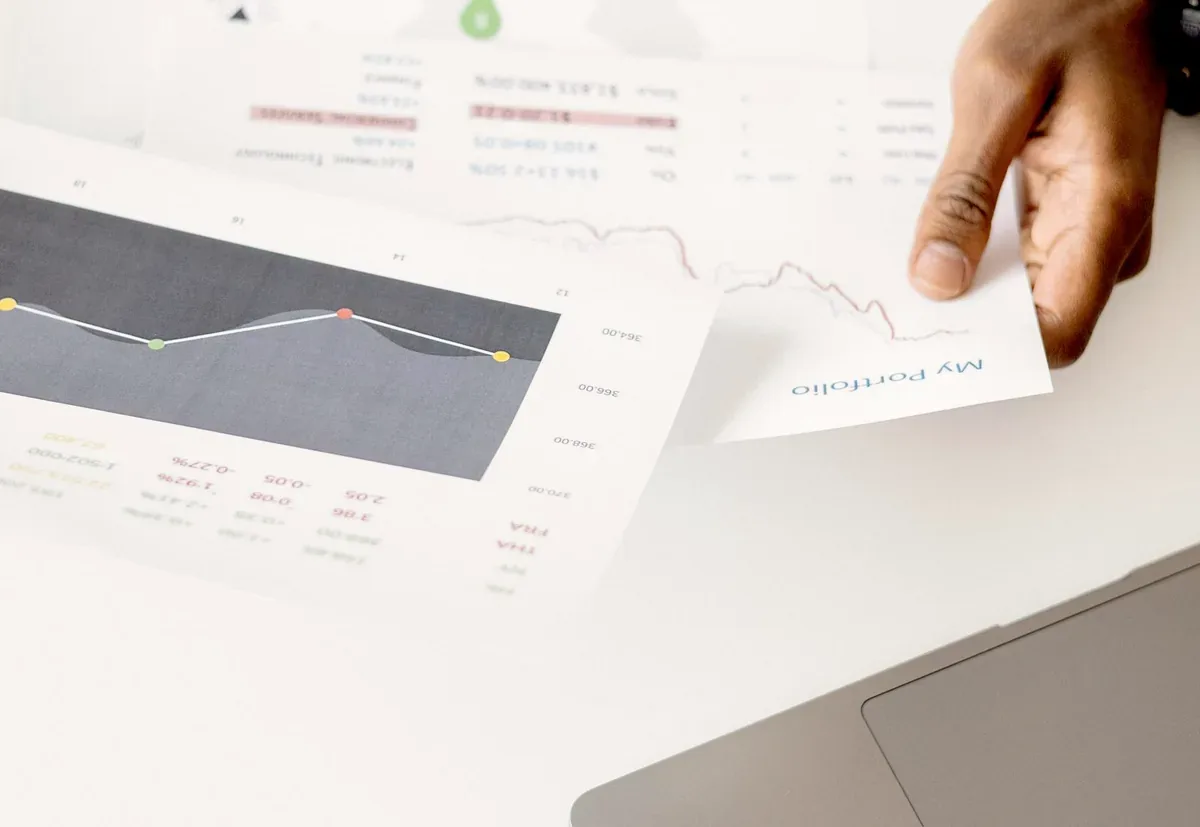
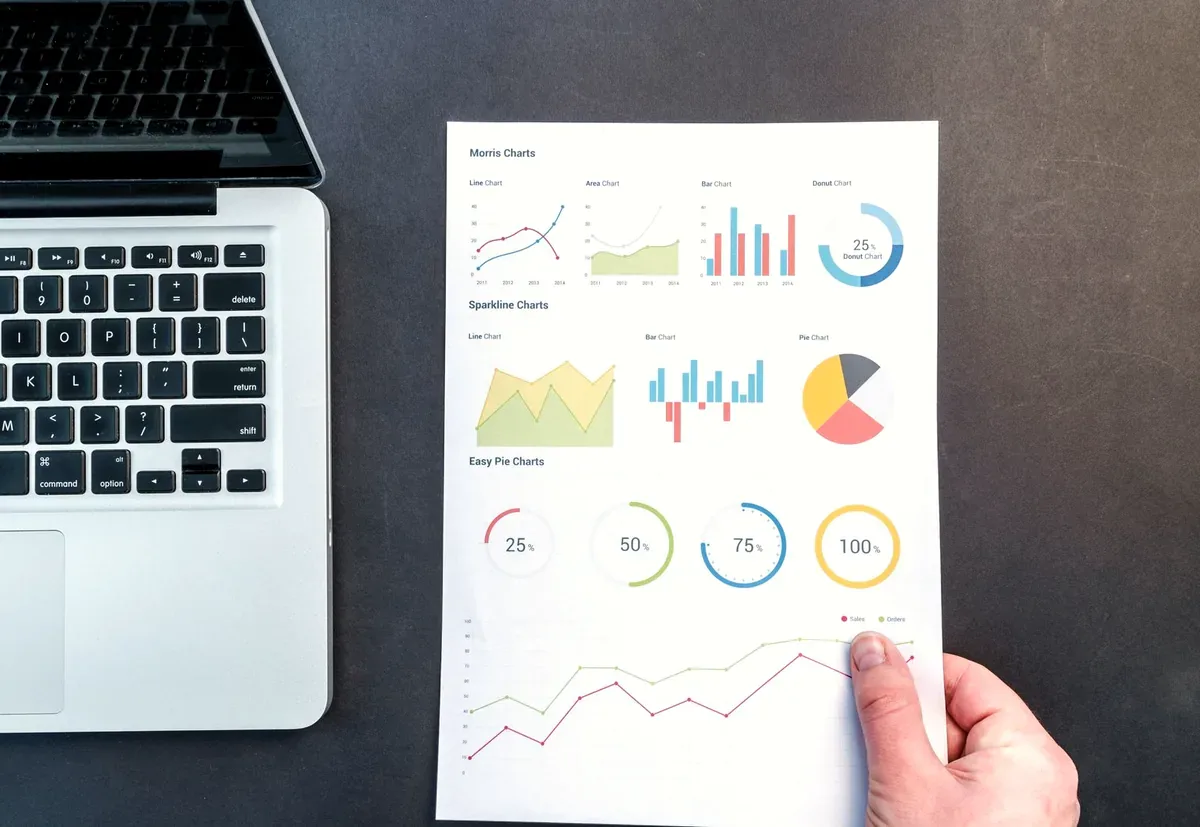
A single dashboard that turns four exported spreadsheets into one honest screen.

Every Monday, someone spent three hours copying numbers between files, and the totals disagreed.
We cleaned the sources, defined each metric once in writing, and built a dashboard that reads the exports directly.
Monday now takes four minutes, and the numbers agree.
Python · SQL
The hardest part was not the code; it was agreeing what "sales" means. We wrote the definition down first and the dashboard followed.
Tell us what you have in mind. We’ll say plainly what it takes and when it lands.

