
RESEARCH & DATA / 2026
Sales Dashboard — One Screen, Live Numbers
A single dashboard that turns four exported spreadsheets into one honest screen.
Case study ↗
A fully interactive disease-surveillance dashboard — sunburst, treemap, bar-chart race, scatterplots and live-filtering tables — built as one self-contained HTML file on clearly-labelled synthetic data.
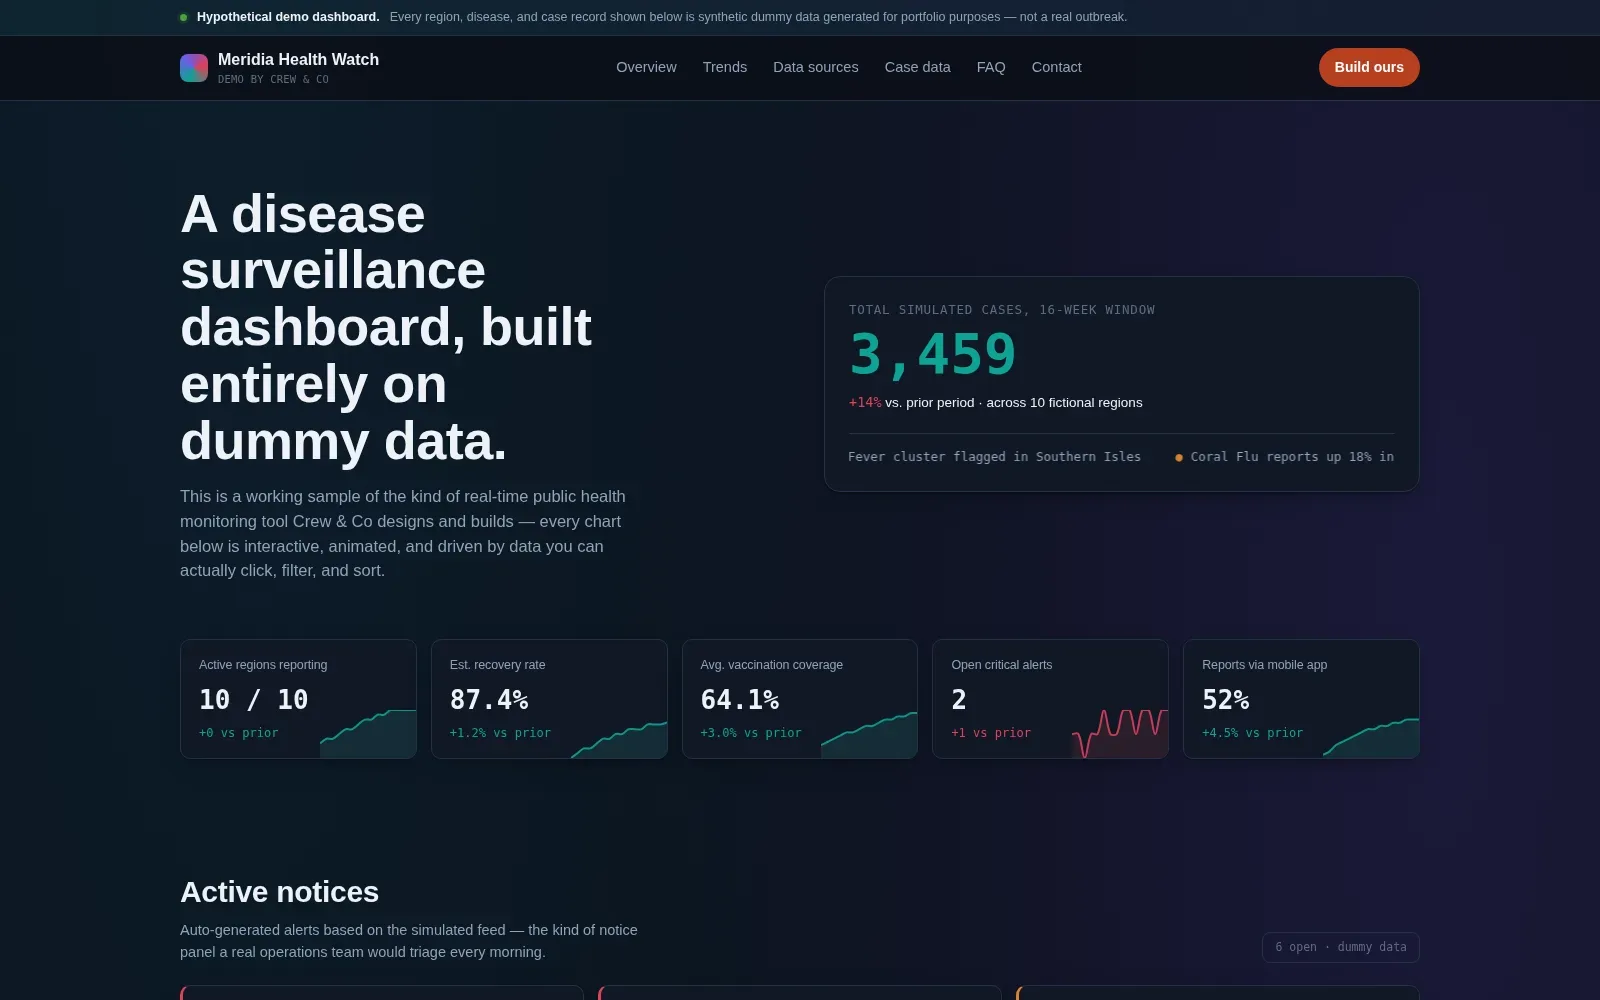
Teams keep being sold "dashboards" that are static screenshots. We wanted proof of the opposite: a monitoring tool where every chart is clickable, animated and filterable — and opens from a single file with no server, login or install.
Designed and built as one self-contained HTML document. Chart.js powers the sunburst, treemap, bar-chart race and scatter views; vanilla JavaScript handles cross-filtering and the synthetic data feed; CSS custom properties carry the dark operations-room theme. Every region, disease and case record is dummy data, and every screen says so.
A demo stakeholders can open anywhere — laptop, tablet or phone — and understand without a presentation. Filters, alerts and chart races stay smooth from a single file under 0.6 MB.
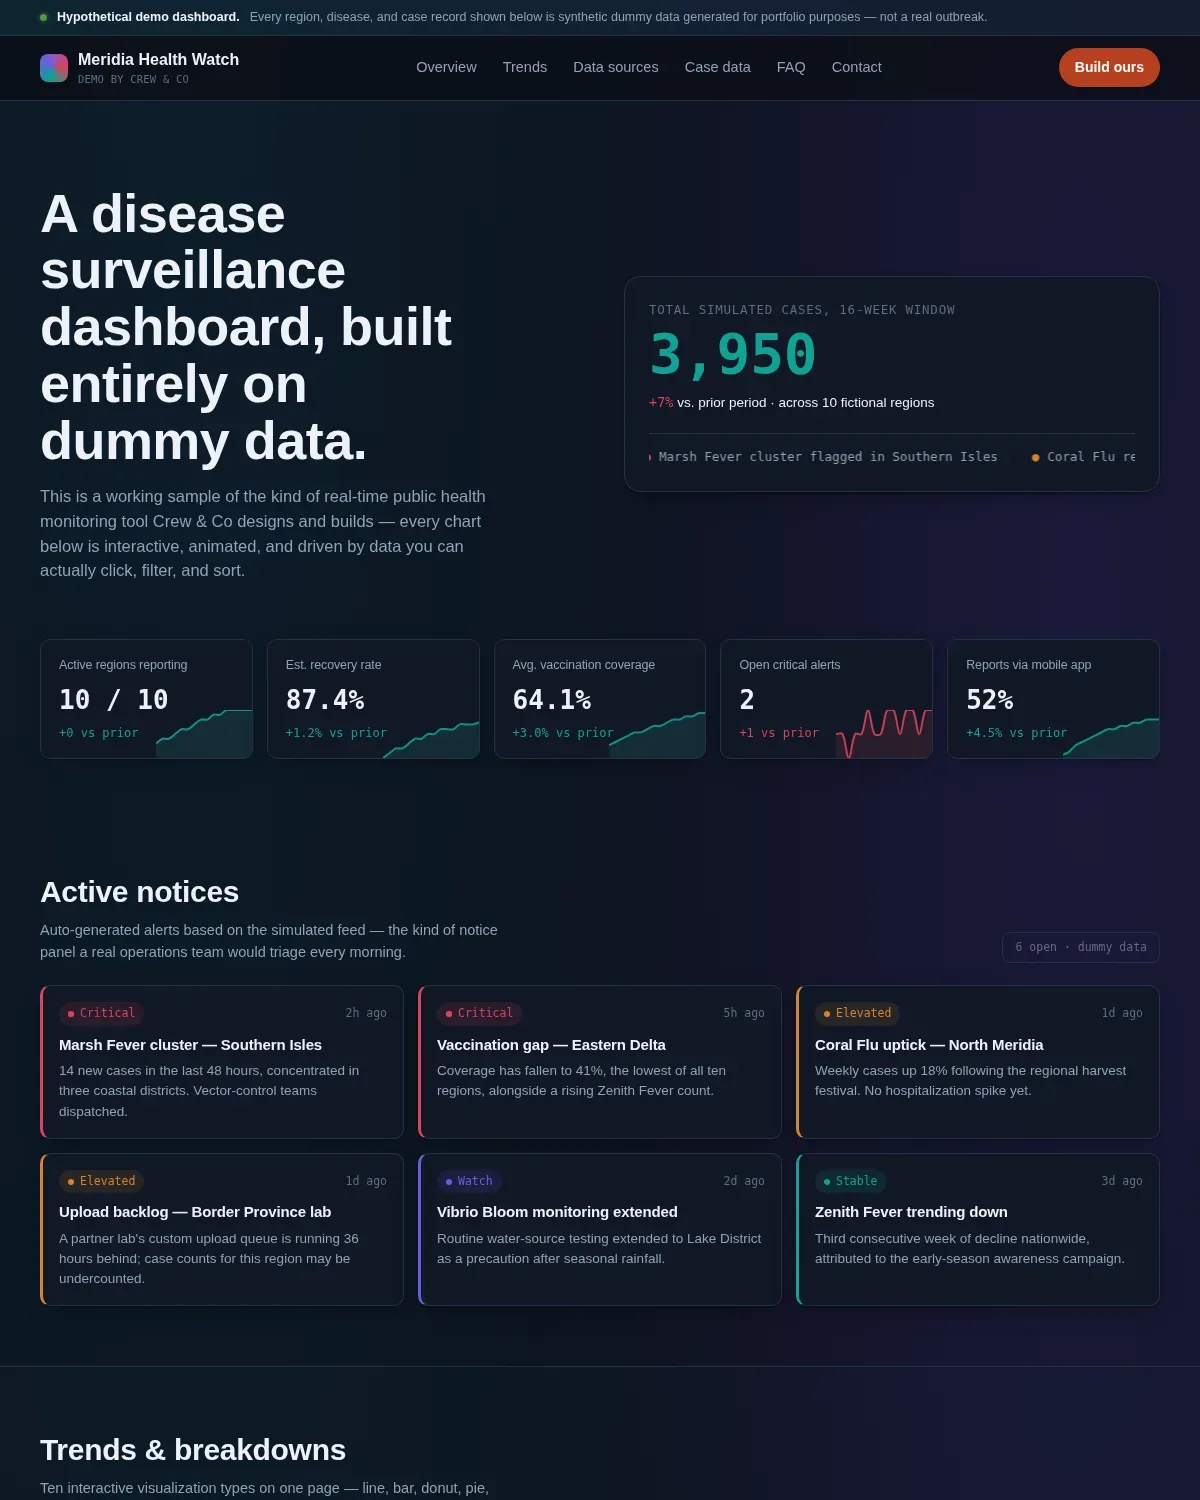
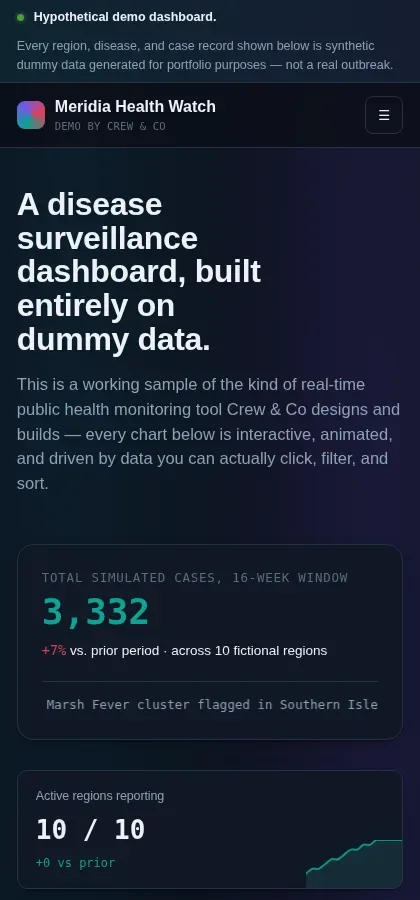

HTML5 · CSS3 · Vanilla JavaScript · Chart.js · Synthetic data generation
Open it and click anything: the charts filter each other, the alert panel triages itself, and the bar-chart race replays a simulated sixteen-week outbreak window. Nothing here connects to a server — the whole tool is one HTML file, which is exactly the point. It is the kind of monitoring surface we build for public-health, operations and research teams, shown with synthetic data so the honesty rules stay intact.
Tell us what you have in mind. We’ll say plainly what it takes and when it lands.

